Prometheus Metrics & Grafana
The SDK ships four pre-built Grafana dashboards and a Prometheus scrape pipeline. Everything is auto-provisioned inside the all-in-one container.
Architecture
instrumentation-sdk
        │
        ▼
  FastAPI REST API ──► Tempo  (traces)
        │
        ▼
   Prometheus ──────► Grafana
  localhost:9090        localhost:3002
Quick Start
Navigate to Dashboards → LLM Observability to see all four dashboards.
Dashboards
1. LLM Latency & TTFT
http://localhost:3002/d/llm-latency-ttft-dashboard
| Panel | What it shows |
|---|---|
| Latency Percentiles (p50/p95/p99) | End-to-end call latency by model |
| TTFT Percentiles | Time to first token for streaming |
| Avg Latency vs Avg TTFT | Bar chart comparison per model |
2. LLM Cost Dashboard
http://localhost:3002/d/llm-cost-dashboard
| Panel | What it shows |
|---|---|
| Cumulative Cost Over Time | USD cost per service + model |
| Cost Distribution by Model | Donut chart |
| Cost Distribution by Service | Horizontal bar chart |
3. LLM Error & Retry
http://localhost:3002/d/llm-error-retry-dashboard
| Panel | What it shows |
|---|---|
| Success vs Error Rate | Stacked time series |
| Finish Reason Distribution | stop, length, content_filter |
| Retry Rate (%) | Gauge |
4. LLM Security & Safety
http://localhost:3002/d/llm-security-safety-dashboard
| Panel | What it shows |
|---|---|
| PII Detection Rate | Detections/sec by service |
| Injection Attempts Rate | Attempts/sec by service |
| Total Security Violations | Cumulative count |
Screenshots
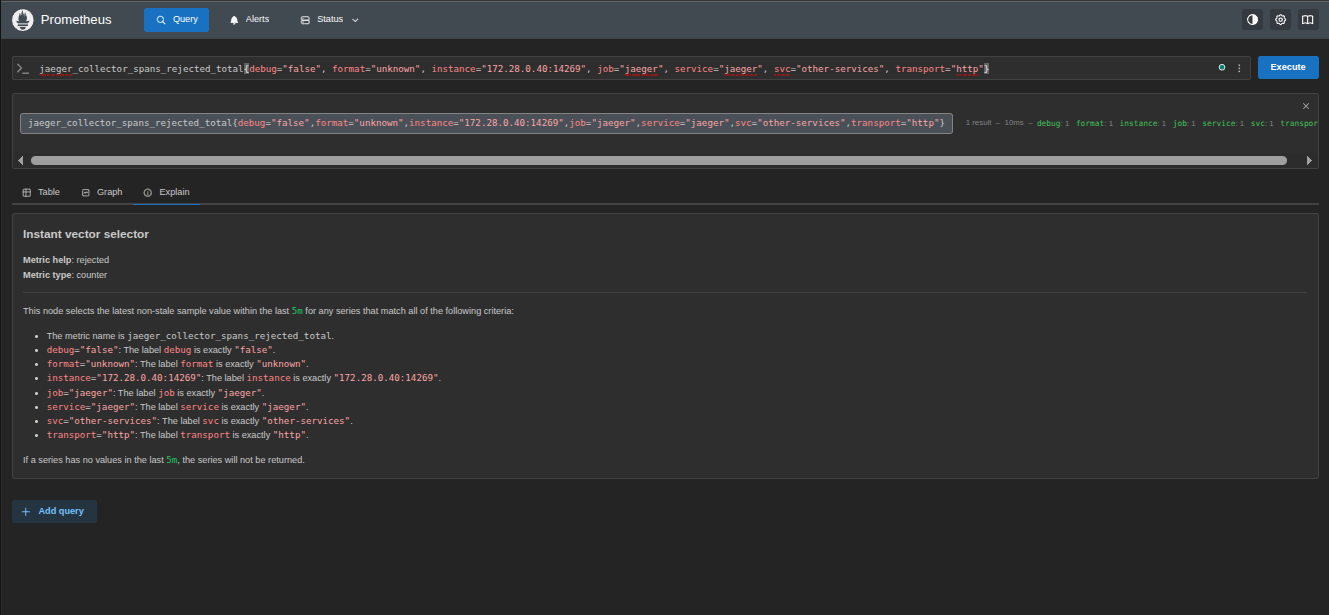 Prometheus scraping LLM metrics every 5 seconds
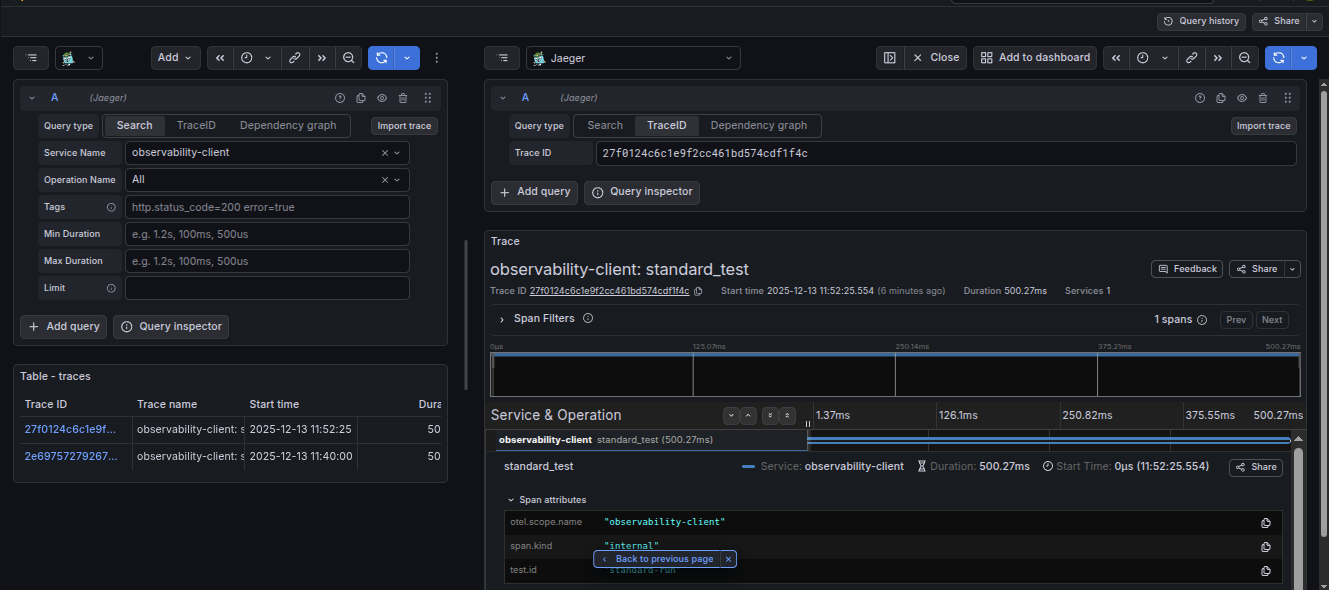 Grafana Tempo showing distributed traces from LLM calls
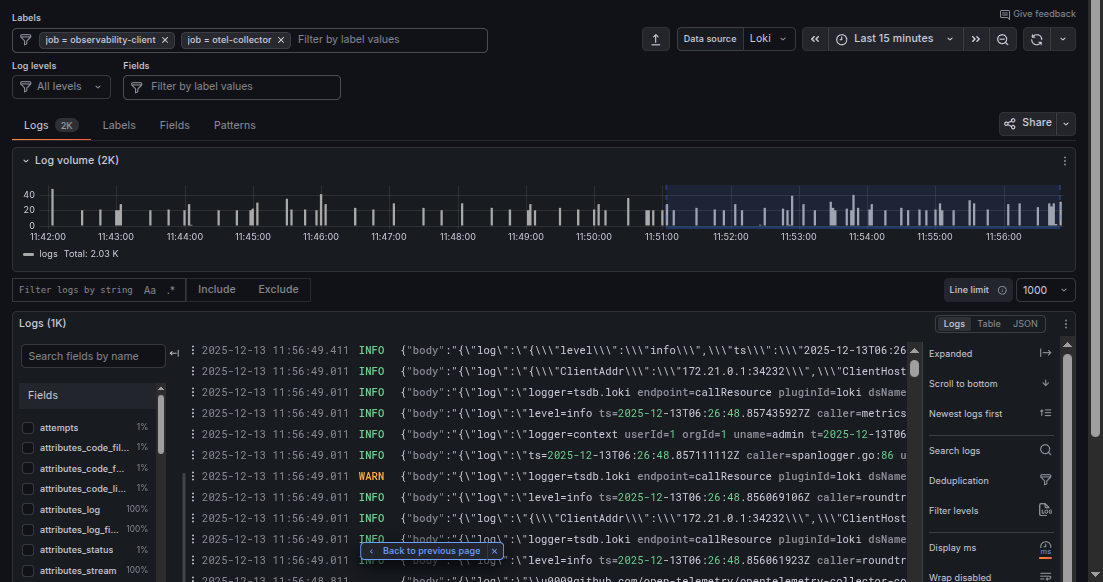 Structured logs aggregated via Loki
Initialize the Metrics Pipeline
curl -X POST http://localhost:8002/v1/metrics/init \
  -H "Content-Type: application/json" \
  -d '{"port": 9464}'
Record a Span Manually
curl -X POST http://localhost:8002/v1/metrics/record \
  -H "Content-Type: application/json" \
  -d '{
    "model": "gpt-4o", "provider": "openai", "service_name": "chat-api",
    "prompt_tokens": 150, "completion_tokens": 80,
    "latency_ms_total": 420, "latency_ms_ttft": 95,
    "finish_reason": "stop", "status": "success",
    "pii_detected": false, "injection_attempt": false, "retry_count": 0
  }'
Prometheus Metrics Reference
Scraped from http://localhost:9464/metrics every 5 seconds.
| Metric | Type | Labels |
|---|---|---|
llm_tokens_total | Counter | model, provider, service_name, token_type |
llm_cost_usd_micro_total | Counter | model, provider, service_name |
llm_latency_ms_total | Histogram | model, provider, service_name |
llm_latency_ms_ttft | Histogram | model, provider, service_name |
llm_pii_detected_total | Counter | service_name |
llm_injection_attempts_total | Counter | service_name |
llm_finish_reason_total | Counter | model, provider, service_name, finish_reason |
llm_spans_total | Counter | model, provider, service_name, status, has_retries |
Add a New Model Price
Edit config/model_prices.yaml:
- model: gpt-5
  provider: openai
  input_price_per_1m: 10.00
  output_price_per_1m: 30.00
  version: "2026-01-01"
Then restart:
Dashboard Hot-Reload
| File changed | Action |
|---|---|
config/model_prices.yaml | Restart container |
config/patterns.yaml | Restart container |
build/dashboards/*.json | Auto hot-reloaded ✅ (every 30s) |