LLM Observability SDK
Python SDK for capturing, enriching, and analyzing LLM call telemetry with zero-to-minimal code changes.
What is this?
The LLM Observability SDK instruments your Python application to automatically capture every LLM API call — latency, token counts, cost, PII detection, streaming TTFT, and more — then sends it all to a pre-wired Grafana + Prometheus + Tempo stack.
Your App ──► LLM Provider (OpenAI / Anthropic / LiteLLM / LangChain)
    │
    ▼ (auto-instrumented)
instrumentation-sdk
    │
    ├──► FastAPI REST API  (localhost:8002)
    ├──► Prometheus        (localhost:9090)
    ├──► Grafana Dashboards (localhost:3002)
    └──► Tempo Traces      (localhost:4317)
Observability Stack
The all-in-one container ships four pre-built dashboards:
| Dashboard | What it shows |
|---|---|
| LLM Latency & TTFT | p50 / p95 / p99 latency and time-to-first-token per model |
| LLM Cost | USD cost per service and model over time |
| LLM Error & Retry | Success vs error rate, finish reason distribution |
| LLM Security & Safety | PII detection rate, prompt injection attempts |
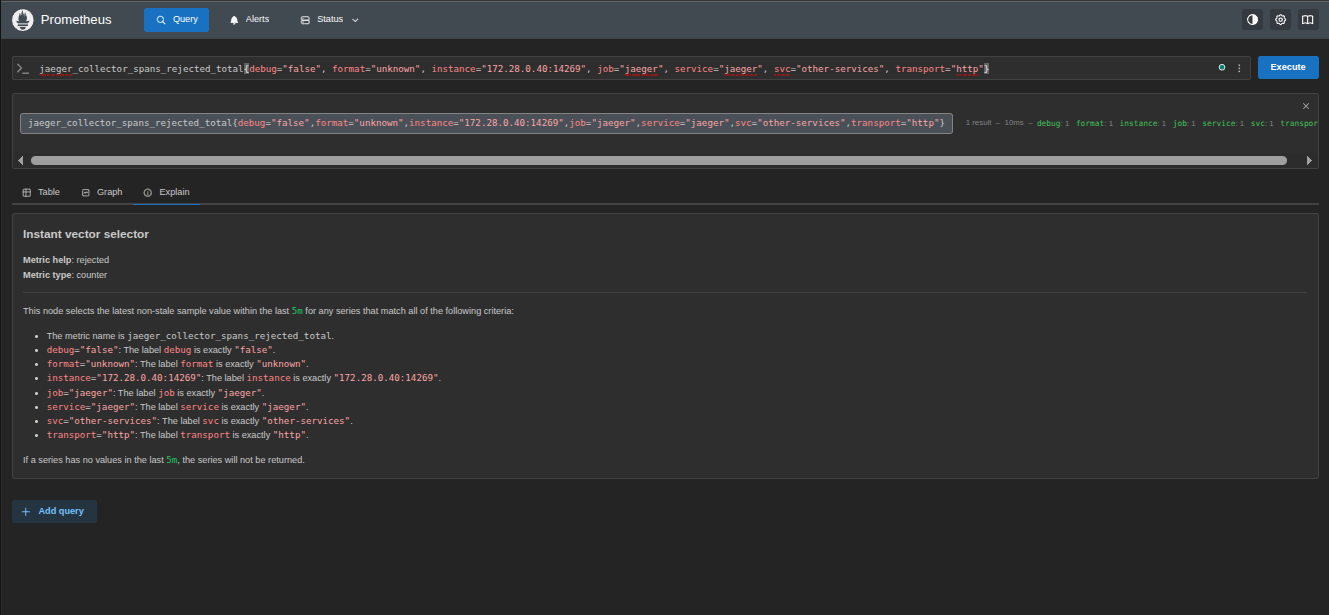 Prometheus metrics scraped every 5 seconds from the SDK
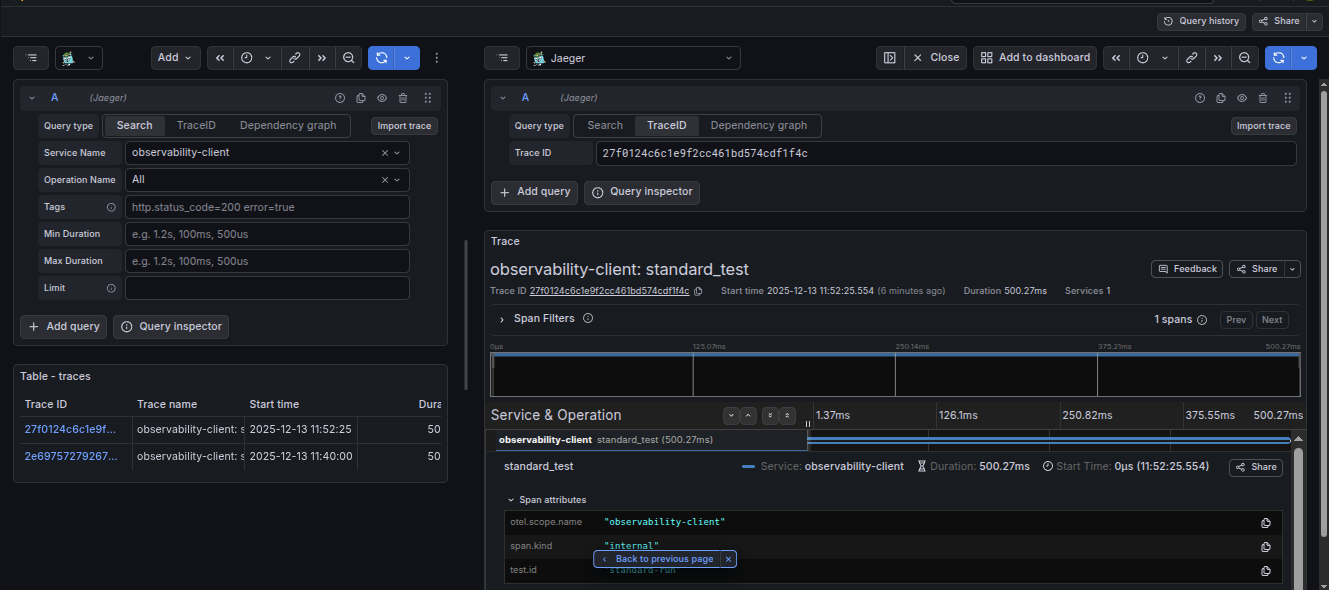 Distributed traces sent via OTLP to Grafana Tempo
5-Minute Quick Start
Then add one line to your app:
Open Grafana at http://localhost:3002 — spans appear within 5–10 seconds.
SDK Feature Map
instrumentation-sdk & temporal-ewma-worker
│
├── Auto-Instrumentation        → zero-code patching
│   ├── OpenAI
│   ├── Anthropic
│   ├── LiteLLM
│   └── LangChain
│
├── Manual Instrumentation
│   ├── @llm_observe            → decorator
│   ├── llm_span                → context manager
│   └── llm_span_with_tokens    → context manager + pre-call token count
│
├── Streaming Observability
│   ├── wrap_stream             → sync TTFT tracking
│   └── wrap_async_stream       → async TTFT tracking
│
├── Security
│   ├── PII Scanning            → Aho-Corasick + regex redaction
│   └── Injection Detection     → SQL / prompt-override patterns
│
├── Sampling
│   └── Deterministic Gate      → SHA-256 % 100 (1% sampled)
│
├── Embeddings
│   └── MiniLM                  → async 384-dim prompt embeddings
│
├── Cost Anomaly Detection
│   └── Temporal EWMA worker    → decoupled scheduled baseline computing
│
└── Observability Backend
    ├── Prometheus Metrics       → 8 metric families
    ├── Grafana Dashboards       → 4 pre-built dashboards
    └── Tempo Traces             → OTLP distributed tracing
Documentation Pages
| Page | What it covers |
|---|---|
| Installation & Quick Start | Install, first span, verify it works |
| Auto-Instrumentation | Zero-code patching for OpenAI, Anthropic, LiteLLM, LangChain |
| Manual Spans — Decorator | @llm_observe decorator usage |
| Manual Spans — Context Manager | llm_span / llm_span_with_tokens context managers |
| Streaming Observability | TTFT tracking, wrap_stream, wrap_async_stream |
| PII & Injection Scanning | Aho-Corasick redaction, scan API |
| Deterministic Sampling | SHA-256 modulo-100 gate |
| MiniLM Embeddings | Async 384-dim prompt embeddings |
| Prometheus Metrics & Grafana | Cost, latency, TTFT dashboards |
| Temporal EWMA Cost Anomaly Detection | Decoupled EWMA baseline computing & cost anomaly detection worker |
| REST Management API | Full endpoint reference |
| Docker & CLI Deployment | llm-observe CLI, all-in-one container |
| Config Files Reference | Model prices, PII patterns, infra configs |
Current Version
1.8.2 — see Changelog